Special Report: Vision-based system monitors blow molding
Intravis Inc., Norcross, Ga., in February launched IntraVisualizer, its first production monitoring system that uses the data from its inspection systems to create charts and graphs of production data. The company is a supplier of inline vision inspection systems that check blow molded bottles, injection molded preforms and closures, and label registration on bottles.
"We collect a lot of data with our multi-camera vision systems on our Watcher inspection products. Dimensional data, material data and color data are some of the information that is captured. We can use our equipment to see what is happening within the production environment," said President Andreas Mueller.
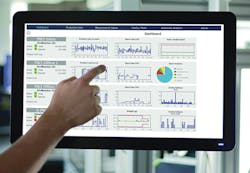
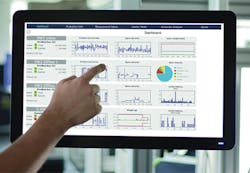
Intravis developed IntraVisualizer to correlate production information derived from vision-based inspection into more usable figures and graphs the operator can understand and act on. IntraVisualizer requires little operator training. It has a browser-based interface with a touch screen that can be located off the plant floor.
Users can populate the display screen of the monitor with product quality statistics of their choosing. Production data for different time periods can be created and grouped. The data include production rate over a shift or a day and cavity faults and product rejects.
MONITORING SYSTEM PIGGYBACKSON VISION INSPECTION
The IntraVisualizer production monitoring system is an add-on to the Watcher series of inspection systems, which provide real-time data on the production environment. The IntraVisualizer system can tie into three of the company's vision inspection products, including LabelWatcher 360, which is designed to inspect the labels on cylindrical blow molded containers from all sides at a rate of 10 containers per second. "Label offset is important to monitor because a label is usually applied after the bottle is filled and capped. An offset label turns the finished bottle from a good product into scrap," said Mueller.
Intravis also offers CapWatcher III, the third generation of its closure inspection unit, which employs six high-resolution color cameras to capture images of each closure inline at production speeds of up to 240,000 closures per hour. The vision system can spot tiny holes in the part and handle translucent closures and bottles with low side wall heights and small tamper-evident bands.
The company's PreWatcher III system for inline use provides a 360-degree quality control check on injection molded preforms and is designed to operate inline with the molding unit operating at rates of up to 72,000 preforms per hour. PreWatcher III uses three cameras to monitor the preform thread, three cameras to inspect the body and two cameras that inspect the top sealing surface and gate area. It checks for length and shape deviations, material defects, holes and notches in the gate, color and sealing surface issues.
Intravis updated LabelWatcher 360, CapWatcher III and PreWatcher III last year. It also offers IMLWatcher, which inspects for label presence, identity, position and seam, as well as wrinkles and bubbles. Its BarrierWatcher checks interior layers within a finished product for irregularities using specially designed cameras. In addition, it checks thin walls for holes and examines surfaces. SpotWatcher performs a 360-degree inspection of extrusion and stretch blow molded bottles, checking for flash, color streaks, holes, burn spots, material defects, contamination, ovality and choked necks. A Sample-PreWatcher system inspects batches of preforms for weight, contamination and defects. Each Watcher system compares an image to a reference sample using a proprietary algorithm.
All the Watcher cameras are equipped with optical character recognition, which allows the inspection system to read the cavity number during production. "This allows the system user to correlate a product defect back to a specific cavity," said Mueller.
VERSATILITY ON VIEW
All data collected from any Watcher program is sent to users' servers; the IntraVisualizer system can even collate data across multiple plants. Using IntraVisualizer software, users can pull that data to generate graphs, diagrams, tables and statistical reports. This allows users to compare production lines to determine which lines operate most efficiently and to discover hidden problems. Production information from similar lines not previously compared in real-time can be viewed side by side.
"The software can finger point where there is a quality issue, which line is losing product and the source for the loss of product," Mueller said. Users can configure the dashboard display to show selected data, which can be grouped as they see fit. Correlating the data to production parameters helps a processor to respond quickly to parameters trending out of specification, which helps to reduce rejects. The IntraVisualizer software employs a color scheme to indicate the quality of the part.
The Intravis system features a 3-D mold diagram function that provides a bar graph showing faults by type and rate. The diagram updates at the end of each cycle. "For maintenance staff, this type of data is extremely valuable. They can view the chart and see that 98 percent of bad parts produced during a shift were made in a specific cavity," said Mueller. The processor does not have to manually evaluate a bad part or conduct a product quality check offline.
Another function provides long-term data analysis of production. The function provides clear information on the estimated time until failure of the monitored item. This helps to identify slow developing problems. A molder producing an injection molded preform having an outer thread dimension of 28mm might not notice a change in thread dimension to 28.05mm after two hours of production, or see when the dimension changed to 28.07 mm four hours into production. "If the molder were just running an inspection system, they might not catch the deviation in the thread until bad bottles were being produced. The trend-statistics function can accurately measure and show that dimensional requirement over numerous cycles," said Mueller.
Trend statistics can be used to reveal long developing changes in production that impact thread dimensions, neck dimensions, wall thicknesses and gate lengths, as well as mold wear and more. Future defects can be avoided with long-term data analysis. A production scheduler feature in IntraVisualizer helps maintenance personnel schedule machine downtime, based on trending data, Mueller said.
Intravis is working with partners to upgrade the IntraVisualizer system into a closed-loop program able to automatically make adjustments when production parameters deviate. "Currently, IntraVisualizer provides data that indicate the trends going on in the production environment. Currently, it is up to the processor to take action when they notice a problem arising," said Mueller.
Mikell Knights, senior correspondent
Contact:
Intravis Inc.,
770-662-5458,

